Estimated Reading Time: 12 Minutes
Terms like the retailization, consumer experience, and customer journey are not new ones. But, especially in this COVID world, they are becoming new again in healthcare. Rightfully so, healthcare needs to understand and communicate to its customers in an improved and more efficient manner. Healthcare is just another consumer industry that got away for too long not being one. Patients are customers no differently than any other product or service industry.
Zeev Neuwirth, MD focuses on completely turning the way we all look at the industry of healthcare on its head in his seminal book, Reframing Healthcare. It starts with making sure we look at the individuals (patients) driving it as what they actually are, customers. Dr. Neuwirth touches upon the latin origins of the word patient which means ‘suffering’. Taking it even further, the verb form of patient is defined as, able to accept or tolerate delays, problems, or suffering without becoming annoyed or anxious. That is awful. No wonder Dr. Neuwirth is passionately advocating for a complete reframing of healthcare. I don’t want to suffer, tolerate delays, or problems and not become annoyed.
A large part of the work done at Tidal Health Group is dedicated to direct to customer (not patient) marketing. We have written about the numerous digital touchpoints (on average 12-15) that consumers have with healthcare brands online before making some physical outreach (graphic and study referenced later). Supporting those interactions is a tall task in itself but when your ideal customer is at the prime decision point are you meeting, improving, and adjusting to their needs at that moment?
Through the group of website properties we manage there is a treasure trove of customer behavioral data. It’s first, and most often last, application is to adjust your marketing efforts around conversion data. While this is important it is not the topic of this article. There are huge operational and customer psychology findings within that data as well.
Our team researched the global data of over 25,000 healthcare appointments spread across all medical specialties in an attempt to glean any trends and findings. One of the first areas of focus will be staffing. We are going to attempt to understand and answers questions like:
- Are your 1st interaction staff member* volumes and working hours right?
- How do you scale up without always hiring more staff*?
- When are your customers (patients) making “purchase” decisions?
*For the sake of this article and diluting its focus I am using ubiquitous terms like “staff” and “1st interaction” to make it clear who I am describing. In truth, the role and title of all players (patients, doctors, staff, etc) deserve a hard look at the terms we give them. But that will be explored in a separate piece.
Staffing volumes are a company-specific metric that needs to be researched much further to understand support needs. But a baseline metric on each type and volume of inbound communication should be gathered (i.e. phone calls, emails, chats, etc). For now we are using the metric of appointments only. Working hours is the concept we will work on for now.
Traditional healthcare working hours are 9 am – 5 pm. Does it make sense to be available only when you are open? If every business operated that way how many customers would they lose? Healthcare should be no different and if anything be even more customer-first*. You have a highly motivated and potentially emotional customer looking to interact and “purchase” something from your brand, why wouldn’t you be ready to jump at that?
*The idea of making healthcare “customer first” is another concept highlighted in Dr. Neuwirth’s book Reframing Healthcare that is worth a read and exploring further.
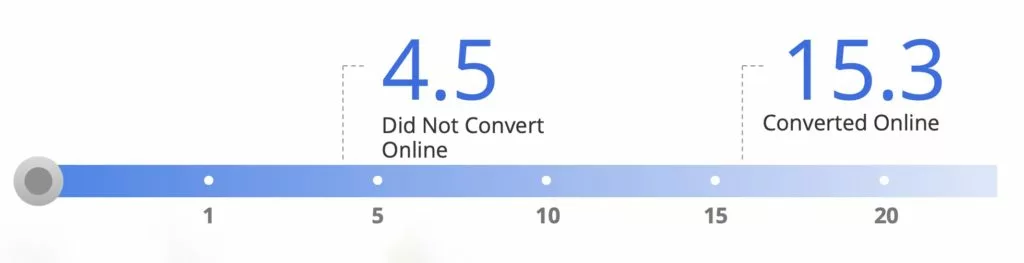
There is an amazing study from 2012 from Google titled “The Digital Journey to Wellness: Hospital Selection” that is even more relevant today. One graphic is very pointed in representing the amount of online research done prior to making an appointment. On average a customer researches 15.3 different websites before they decide to make an appointment compared to only 4.5 when they decide not to. This is useful data to have about the number of customers you may be losing that you didn’t even know about. But where we are focusing on is the next step of the journey. If you have customers having 15 touchpoints with your brand, then making a “purchase” decision, are you converting all of them? Are you available to interact at that “purchase” decision point?
Two immediate sets of data to look at are the day of the week and the time of the day. This graph represents the percentage of those 25,000+ appointments based on what day they were submitted. There are two points that immediately jump out at me.
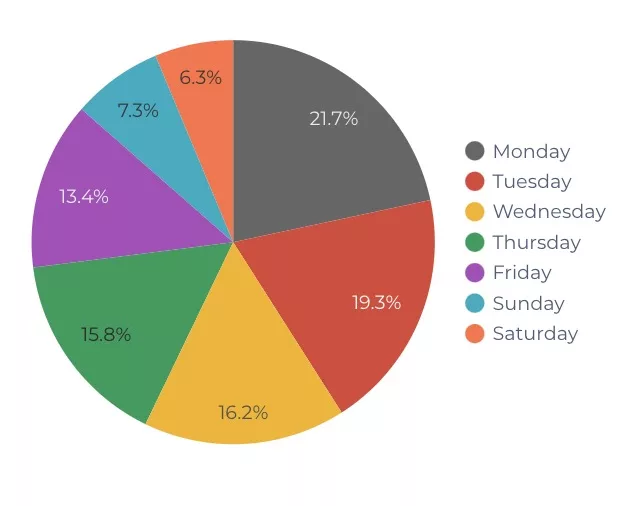
- Almost a majority of appointments are on Monday and Tuesday. 41% to be exact. If your customers are most active on only two days of the week are you supporting that customer activity?
- The smaller, but shouldn’t be ignored, amount that occurred on weekends. 13.6% percent occurred on Saturdays and Sundays. Are you bringing all of those customers in? Do you have processes or tools in place to communicate with them when they want to be? We will explore that last question further into the article. If an appointment, be it something scheduled or requested, comes through on Saturday morning and you don’t interact with that customer actively or passively for another 48 hours is that a good thing? I love to challenge that concept within healthcare. How often do you personally try to purchase or book something online only to be frustrated at the lack of customer support only to end up going to another brand? The answer is, often. Customers, of all industries, are inundated with choice. Customers of healthcare are educating themselves more and more every day and making decisions based on non-clinical reasons before you ever get to interact with them.
The next slice of data is the time of day that the requests come in. In parallel responses to the previous data two points stand out.
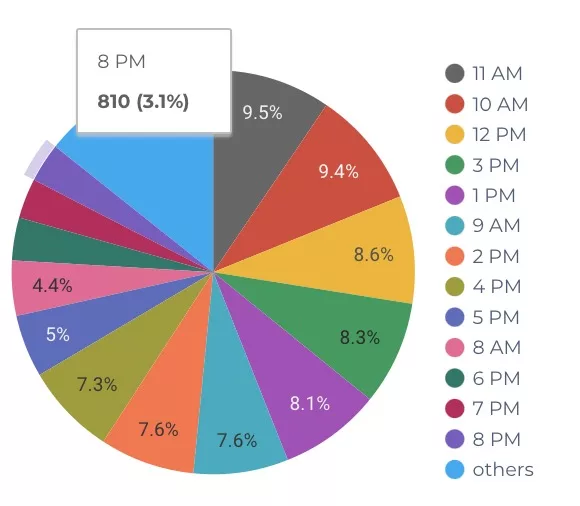
- A large chunk, 27.5% to be exact, occurred between 10 AM – 12 PM. That may not be eye-opening in terms of identifying your busiest time. But it can help define, how busy? Overlapping the previous data lets you isolate Monday and Tuesday between 10 AM and 12 PM as your peak customer service hours. Are you adequately supporting the volume of your peak customer conversion times?
- The volume outside of “normal” business hours should also be taken into consideration. If we agree to define “normal” as 9 am – 5 pm for now it allows us to see that 35.6% of volume occurred outside those hours. That is a massive chunk of business that is occurring when your business isn’t open. Are those customers converting at the same rate as the “normal” business hours customers? If they are, congratulations you run a tight ship. More than likely they are not.
The first two sets of data answer the question of, “When are my customers most likely to buy?” The question that needs to be answered from that is, “Are you meeting your customer’s demands?” More on how-to and the potential implications of not will be explored later.
With an understanding of when we will start to dive into where now. There are endless digital sources you can attribute your customers to, down to on a single web domain level. That level of granularity is useful in other capacities but we are going to keep them in larger buckets for now. The first set of data represents the common digital sources broken down in Google Analytics. These numbers are aggregated across numerous clients, budgets, and other factors to take into consideration.
What jumps out is a question we often get asked and I recently addressed in a podcast interview titled, Does the Internet see you as an Expert? The question I was asked is, “Should we [doctors, institutions] even attempt to compete online with the likes of legacy hospital brands?” (i.e. – Cleveland Clinic, Mayo Clinic, etc). Spoiler alert, in that interview I said yes and this only reinforces that further. Almost half of the appointments came through organic search via google, bing, yahoo, etc. There is no doubting competition is getting harder and ads more expensive but that doesn’t account for the billions of healthcare searches online every year.
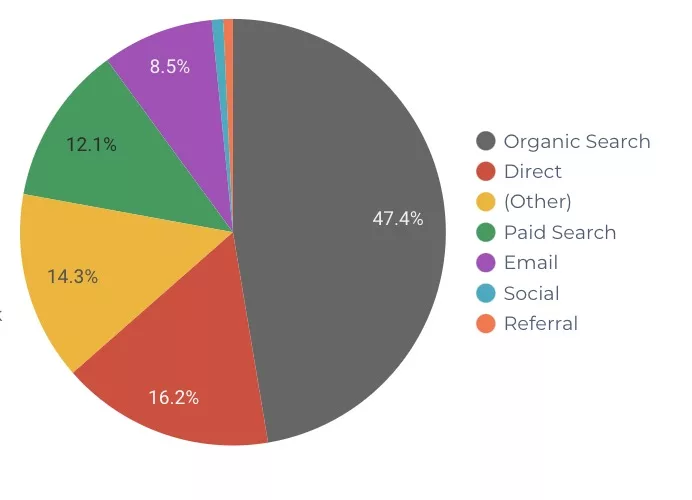
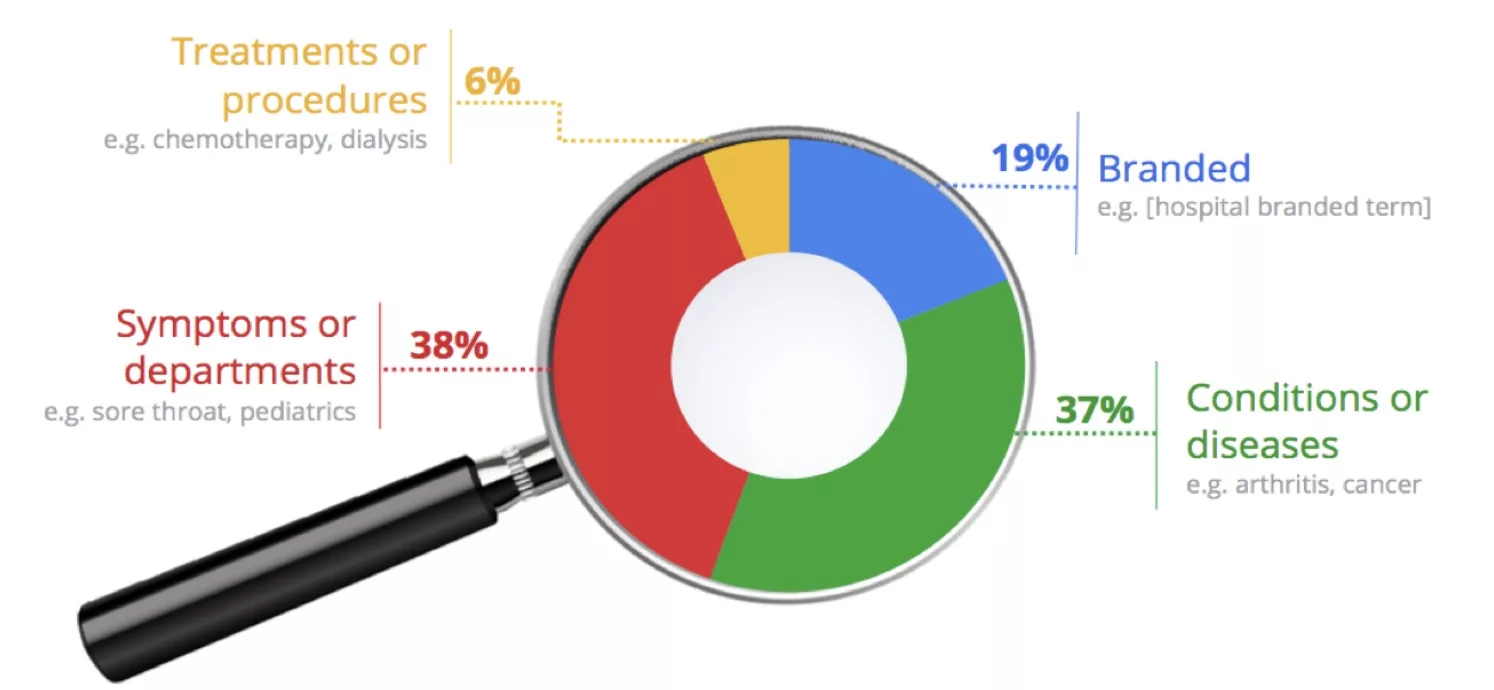
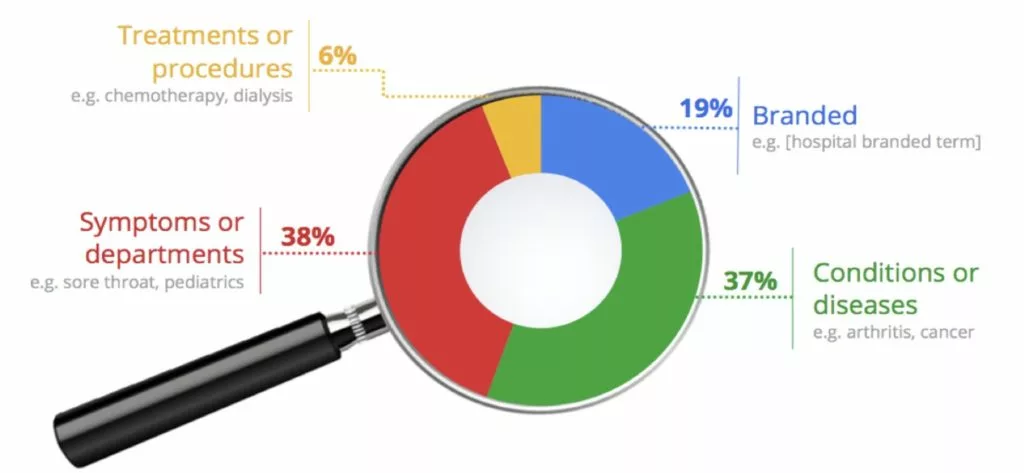
One of our, and should be yours, first pokes at this data is to understand what are those organic searches? The first answer to that is symptoms and conditions. Another graph from the “The Digital Journey to Wellness: Hospital Selection” white paper shows us that symptoms and conditions account for over 70% of online healthcare searches. We push that number even further and track the search buckets of branded vs unbranded ourselves. That branded percentage in terms of the organic search (47.4%) is only 9.8%.
More pointedly stated is, ~43% of appointments came from organic search terms that were NOT branded.
That is almost half of the appointments came from searches that did not identify a doctor’s name or brand. Potential customers were educated and informed about their symptoms and/or condition related search enough that they considered that doctor or brand an authority on the source and wanted to make an appointment. The concept of authority (E.A.T.) from a digital lens is explored further. This number starts to create and answer, does the internet see you as an expert? If you are receiving almost a majority of your “sales” from terms around what you do, not who you are, that is a resounding YES!
While those digital sources are tracked and attributed to automatically the customer can identify or categorize sources differently. A question built into those appointments is one asking the customer to self-identify, “How did you find us?”. Those results can then be compared to our previous report graphic.
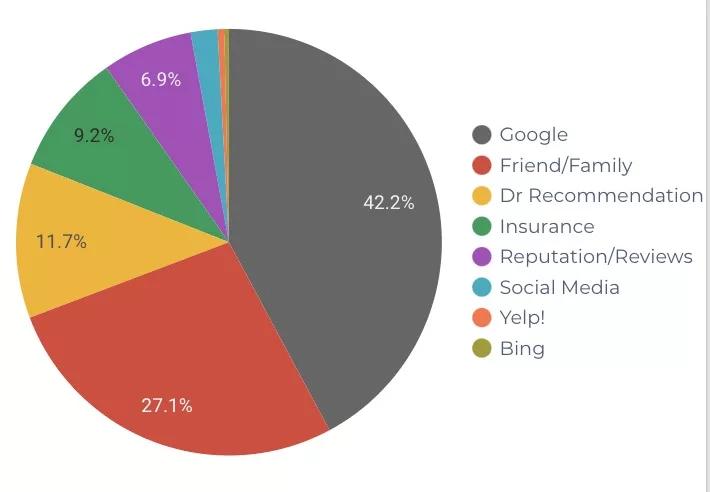
Some immediate points of comparison are:
- “Google” and “Organic Search” are the largest sources and close in percentages. 42.2% versus 47.4%. That makes sense because Google controls the lion share of search engine traffic.
- “Friend/Family” and “Direct” + “Other” are comparatively similar in size. 30.4% and 27.1%.
There will not always be a one to one comparison to draw lines between. The self-identified sources clearly take in many more “real-world” sources. This should spur even more thoughts and validations. Are you tracking “Friend/Family” source growth? Do you have a referral process in place? Are you fostering peer to peer relationships for colleague referrals? Is your data syndicated to insurance directories correctly?
We have addressed staffing volumes and working hours along with understanding where your customers are coming from. But what if you now have all that information and are a growing business? How do you support that growth efficiently?
Our technology partner MedChat helps address those uncontrollable spikes with its HIPAA-compliant chatbot and live chat platform. MedChat is the only one of the handful of platforms with these capabilities to be scaled and feature-rich enough for broad deployment.
Our team adds value to the MedChat platform by building out chatbot workflows proven to increase patient conversion rates and lower staff work effort. We tailor these workflows to each client and then train their staff members. The result is dramatically better response times and labor productivity for both inbound and outbound patient communication.
While MedChat is our technology partner this is not a sales pitch for them. But is it a sales pitch for their mode of communication. Meeting demand and reducing friction are two key factors of customer happiness. It has been proven time and time again that customers prefer passive modes of communication that can relay information much faster (i.e. text and live chat). There are numerous studies that support this so it isn’t worth spending too much time on it. I will reference one great study from Stephen Klasko, MD the CEO of Jefferson Health called Forging a Match.com Relationship with Patients. But there are numerous others that can be found online as well.
Improving your communication efforts is an important piece to being “customer first” but it is only a piece of the puzzle. We have walked through a lot of data and steps along the customer journey. At the end of the day, all of this and the resulting efforts are framed around one concept, customer satisfaction. This certainly isn’t a new concept but it is newer within healthcare. The concept is wrapped into what is leading a massive shift in the economics of healthcare, value-based care.
Value-based care has a mixed reception in its terminology and implementation. That is because it also has a communication problem. I would expand on Dr. Neuwirth’s concept of reframing healthcare even further into how we communicate the financial aspects of it. Value-based care is simply a concept of checks and balances to ensure the product being delivered is meeting its customers expectation. This is not simple in application though. Something that has implications of life and death is difficult to place an objective financial value on. But healthcare is like every other business transaction, there is a transfer of goods and services at an expected value.
The Centers for Medicare & Medicaid Services has already started to standardize customer satisfaction with HCAHPS. These hospital surveys are meant to, ”produce data about patients’ perspectives of care that allow objective and meaningful comparisons of hospitals on topics that are important to consumers.” If CMS is even referring to patients as consumers I think we are already behind the curve. This is an attempt to objectively quantify the subjective aspect of healthcare delivery. Simply put, it is placing a really large value on the customer’s view of their experience.
Customer feedback is important, it is even more important when it is tied to your revenue. As reimbursements only become more and more tied to customer satisfaction they cannot be ignored. As things go, processes at CMS start to become adopted by commercial payers and the industry at large.
If you are only looking at the lens of customer satisfaction through HCAHPS you are doing your business a disservice. Taking a hard look at every aspect of your customer’s experience will not only help improve your general business it will improve your revenue.